MDSS mBUDGET
Run the budget process, not just the ledger.
Dashboards and Reporting
Dashboards and Reporting
Live dashboard views and the full reporting family for executives, departments, and finance.
Budget at a Glance
Budget at a Glance
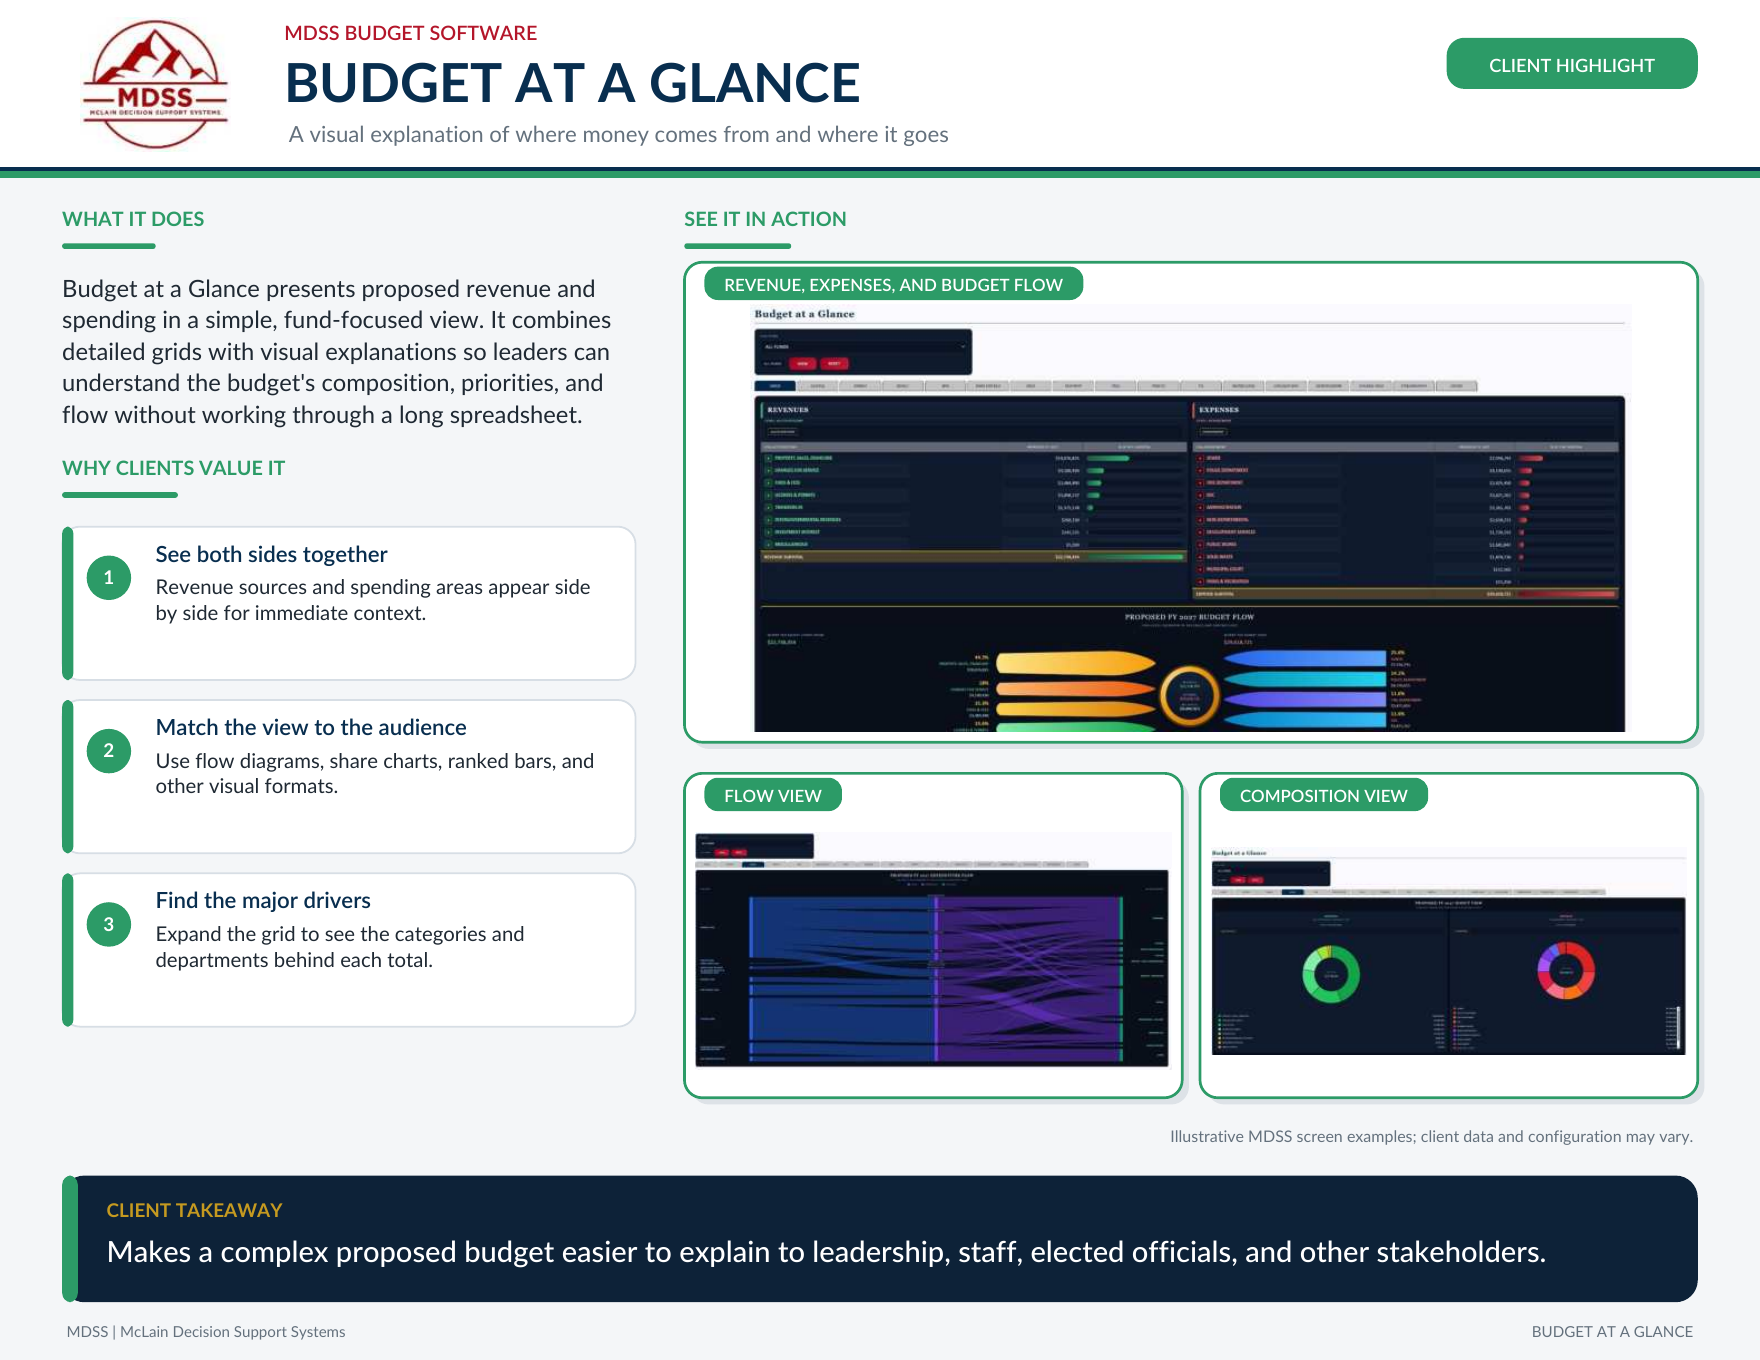
A visual explanation of where money comes from and where it goes, combining detailed grids with flow and composition views.
Where money comes
from and where it goes stays clear with grids plus flow and composition views. Revenue sources and spending areas sit side by side for public and board audiences.
Share charts, ranked
bars, and expandable grids surface the major drivers behind each total. Meeting-ready visuals reduce last-minute slide rebuilds.
Public-facing and board
audiences get the same composition story finance already trusts. Flow and share visuals reduce last-minute slide work when explaining sources and uses.
Public and board
audiences receive the same sources-and-uses story mid-year as composition and flow views update together. That governance continuity reduces conflicting handouts when explaining where money comes from and where spending goes, and boards receive the same story staff already trust.